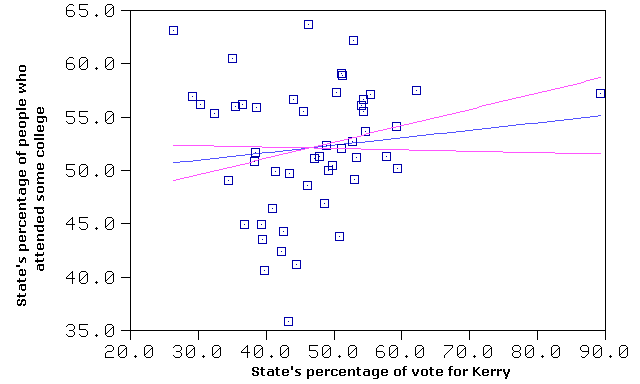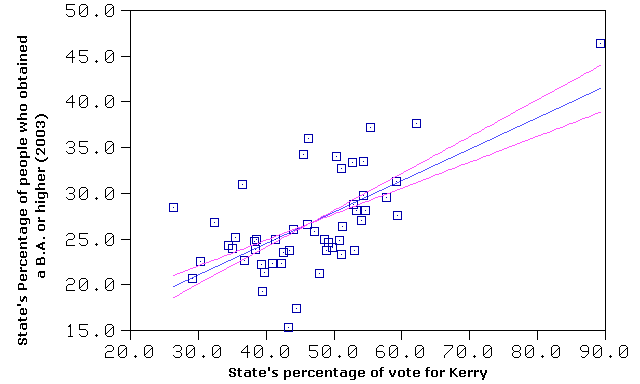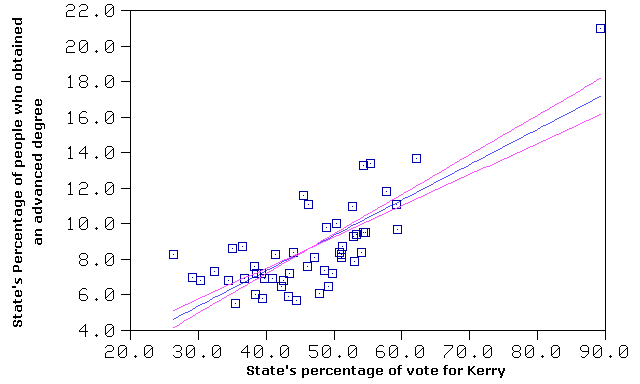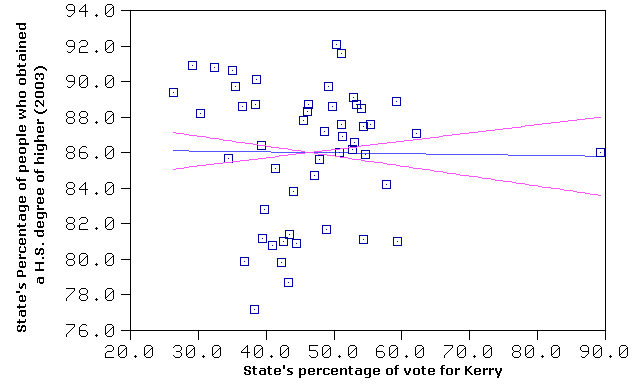
- The blue line is the least squares best fit to the data (points).
- The pink lines have slopes 1 sigma away from the best fit. They intersect at the mean of x and y for the data.
- number of events entered: 51
- slope: -0.00 +/- 0.05
- y intercept: 86.24 +/- 0.09
- dispersion: 2.44
- correlation coefficient: -0.01
- chi ^ 2 (degrees of freedom): 694.0 ( 49)